This post is an editorial. We are including new benchmark results, which should theoretically give you something new to discuss, but pleaseee take it with a grain of salt, as there’s simply not enough data to make any final judgments.
Let’s start with a list of all AMD Ryzen CPUs compared to Intel’s current offering based on available information.
| Desktop Processors | ||||||
|---|---|---|---|---|---|---|
| Model | Cores | Threads | Base Clock | Turbo Clock | TDP | Chinese Price (Yuans) |
| Intel Broadwell-E & Kabylake CPUs | ||||||
| Core i7 6950X | ||||||
| Core i7 6900K | ||||||
| Core i7 6850K | ||||||
| Core i7 6800K | ||||||
| Core i7 7700K | ||||||
| Core i7 7700 | ||||||
| Core i5 7600K | ||||||
| Core i5 7500 | ||||||
| Core i3 7350K | – | |||||
| AMD Ryzen CPUs | ||||||
| Ryzen 7 1800X | ||||||
| Ryzen 7 1700X | ||||||
| Ryzen 7 1700 | ||||||
| Ryzen 5 1600X | ||||||
| Ryzen 5 1500 | ||||||
| Ryzen 5 1400X | ||||||
| Ryzen 5 1300 | ||||||
| Ryzen 3 1200X | ||||||
| Ryzen 3 1100 | ||||||
AMD Ryzen 3DMark Physics
Okay here’s what you were asking for, but first we need to explain what are we showing here. What’s 3DMark Physics score? Physics score is the reason why we never use Overall 3DMark scores, simply because this value is (obviously) only calculated on the CPU, which is kind of useless when benchmarking GPUs. But if we were to benchmark only CPUs, Physics score suddenly becames interesting. The Fire Strike test is really heavy on GPU and CPU. The physics part is very CPU intense and it scales nicely with more cores. But who would explain this better than the 3DMark authors themselves:
Physics test
3DMark Fire Strike Physics test benchmarks the hardware’s ability to run gameplay physics simulations on the CPU. The GPU load is kept as low as possible to ensure that only the CPU is stressed. The Bullet Open Source Physics Library is used as the physics library for the test.
The test has 32 simulated worlds. One thread per available CPU core is used to run simulations. All physics are computed on CPU with soft body vertex data updated to GPU each frame.
So basically more cores = better performance, but it also matters how fast each core is.
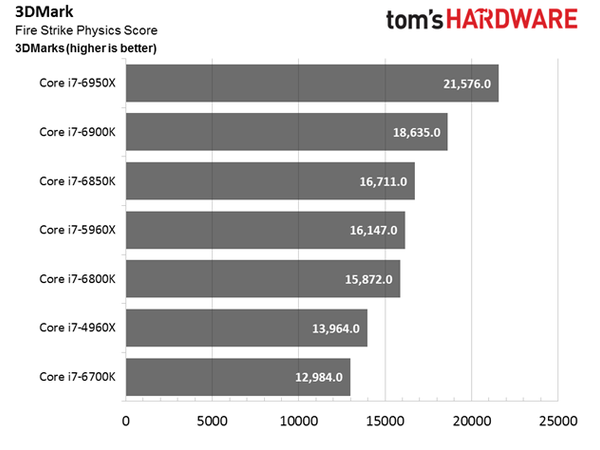
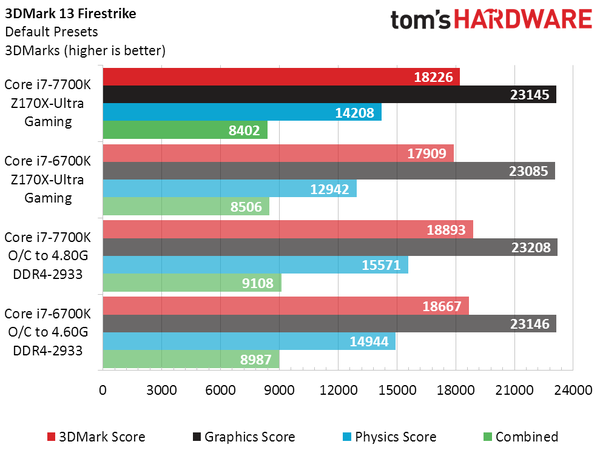
First, we need data for comparison. We could use the official list from Futuremark, which actually shows slightly lower values than what reviewers can achieve, or we could use a review from Tom’s Hardware #link1 #link2.
Legend:
- AMD Ryzen: ZD3406BAM88F4_38/34_Y — Eight-Core CPU
- AMD Ryzen: ZD3301BBM6IF4_37/33_Y — Six-Core CPU
- AMD Ryzen: ZD3201BBM4KF4_34/32_Y — Quad-Core CPU
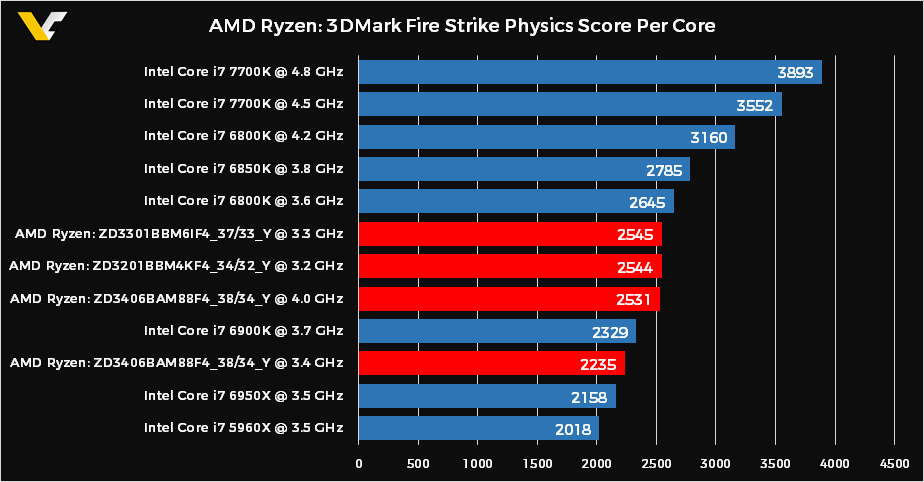
I think the next chart is far my important. Notice how close all Ryzen CPUs are to each other if we take single-thread performance. Kabylake CPUs really are doing better here, but since Ryzen offers more cores, that difference suddenly becomes unimportant.
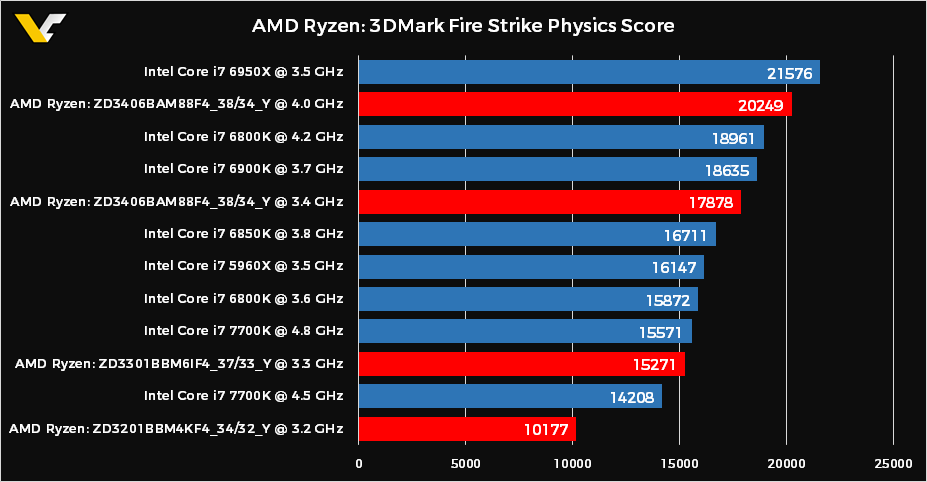
The lesson from this is simple. We can finally start benchmarking GPUs with Ryzen.